Likelihood Ratio – Diagnostic Testing
Likelihood Ratios are used to assess two things; 1) the potential usefulness of a particular diagnostic test, and 2) how likely it is that a patient has a condition/disease.
Clinicians need to know which tests will best help or rule – in or rule – out conditions when performing diagnostic tests. The decision to perform a test should be based on the initial assessment of the likelihood of the condition, and how important it is to rule-in or rule-out the condition.
The likelihood of the condition/ disease (“pre-test probability”) need to be assessed. Likelihood ratios tell us how much we should shift our suspicion for a particular test result.
Positive likelihood ratio (LR+)
Positive likelihood ratio is the ratio of positive test results in patients with the pathology (true positives) compared to positive test results in patients without the pathology (false positives). LR+ corresponds to the concept of “ruling-in disease.”
Negative likelihood ratio (LR-)
Negative likelihood ratio is the ratio of negative test results in patients with the pathology (false negatives) compared to negative test results in patients without the pathology (true negatives). LR-corresponds to “ruling-out disease.”
Likelihood Ratio Interpretation
- LR+ and LR- don’t change as the underlying probability of disease changes (predictive values do change)
- LR’s using multiple “levels” of positive (i.e. not just a simple positive/negative result) which provide much better, more useful information to you as a clinician and help take into consideration the subtleties of interpreting many physical exam procedures
- LR+ > 1 indicates an increased probability that disorder is present (bigger number is better)
- LR- < 1 indicates a decreased probability that disorder is present (smaller number is better)
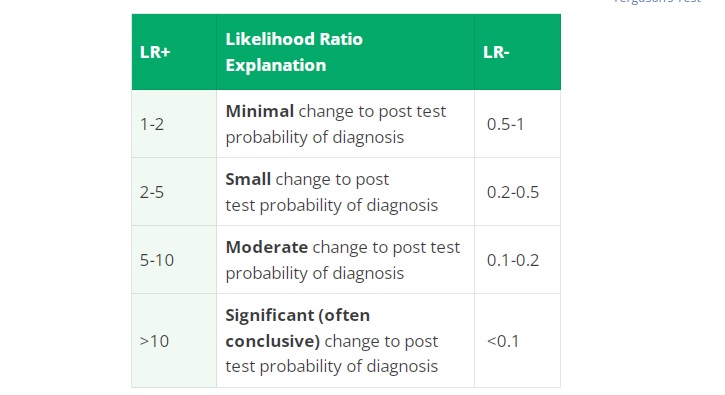
Likelihood Ratio Table
- The table below contains general guidelines on the meaning of the values of Likelihood Ratios, which must be correlated with each individual clinical scenario
| LR+ | Likelihood Ratio Explanation | LR- |
|---|---|---|
| 1-2 | Minimal change to post test probability of diagnosis | 0.5-1 |
| 2-5 | Small change to post test probability of diagnosis | 0.2-0.5 |
| 5-10 | Moderate change to post test probability of diagnosis | 0.1-0.2 |
| >10 | Significant (often conclusive) change to post test probability of diagnosis | <0.1 |
